12. Automated Reasoning with pmie
12.1. Overview
The Performance Metrics Inference Engine (pmie) is the tool within PCP that is designed for automated filtering and reasoning about performance.
pmie evaluates a set of assertions against a time-series of performance metric values collected in real-time from PMCD on one or more hosts or from one or more PCP archives.
For those assertions that are found to be true, pmie is able to print messages, activate alarms, write syslog entries and launch arbitrary programs.
Typical pmie usage might include:
monitoring for exceptional performance conditions
raising alarms
automated filtering of acceptable performance
early warning of pending performance problems
“call home” to the support center
retrospective performance audits
evaluating assertions about “before and after” performance in the context of upgrades or system reconfiguration
hypothesis evaluation for capacity planning
as part of the post mortem analysis following a system failure
12.2. pmie basics
The simplest rules test thresholds and are formed from expressions involving performance metrics and constants. For example, the following statement:
If the context switch rate exceeds 2000 switches per second
then activate an alarm notifier
may be translated into the following pmie rule:
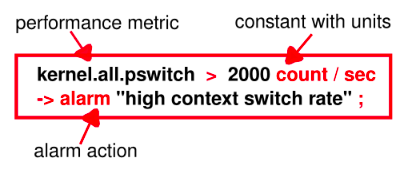
where the “alarm” action launches an information dialog with the specified message.
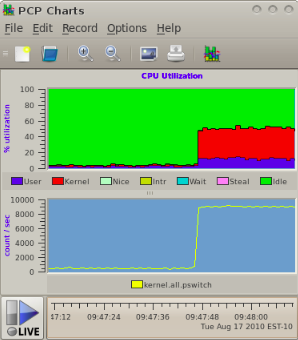
Generate a lot of context switches, and watch them:
$ . /etc/pcp.env
$ pmie -v -c $PCP_DEMOS_DIR/pmie/pswitch.pmie &
$ pmchart -t 1sec -c $PCP_DEMOS_DIR/pmie/pswitch.view &
$ while true; do sleep 0; done &
$ jobs
[1]- Running     pmie -v -c $PCP_DEMOS_DIR/pmie/pswitch.pmie &
[2]- Running     pmchart -t 0.5sec -c $PCP_DEMOS_DIR/pmie/pswitch.view &
[3]+ Running     while true; do sleep 0; done &
Important
The above test case can be quite intrusive on low processor count machines, so remember to terminate it when you’ve finished this tutorial.
$ jobs
...
[3]+ Running     while true; do sleep 0; done &
$ fg %3
12.3. Action repetition and launching arbitrary actions
Sometimes it is useful for an action not to be repeated for a time. For example, the English statement:
If the context switch rate exceeds 2000 switches per second
then launch top in an xterm window
but hold off repetition of the action for 5 minutes
may be translated into the following pmie rule:
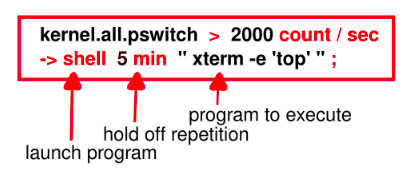
Note
The shell keyword introduces an arbitrary action in which any program can be launched.
12.4. Rule evaluation over sets of values
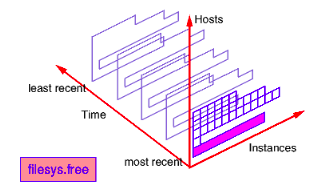
Each pmie rule may be evaluated over a set of performance metric values.
Conceptually these sets of values are constructed for a single performance metric by taking the cross product of observed values over the three dimensions of: hosts, instances and times.
The default host is:
The host named in the -h command line option to pmie, or
The host associated with the archive named in the first -a command line option to pmie, or
The local host if neither -h nor -a appears on the command line.
By default, a metric name represents the set of values formed by the cross product of the default host for pmie, all instances and the current time. If there is only one instance, then the set contains a singular value.
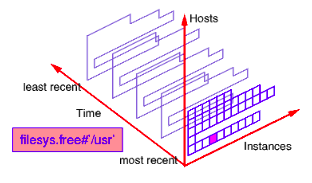
For example- filesys.free is the most recent set of values for the amount of free space on every mounted file system on the default host, and may be represented by the shaded rectangle in the following figure:
One or more suffix of the form #instance (where instance is the external instance identifier) after a metric name restricts the set of values on the default host for pmie, to the nominated instances and the current time. If instance includes any special characters then it should be enclosed in single quotes.
For example- filesys.free #’/usr’ is the most recent value for the amount of free space on the /usr file system on the default host, and may be represented as follows:
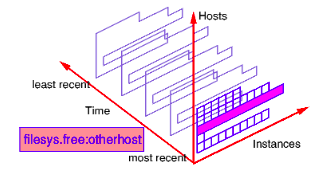
One or more suffix of the form :hostname after a metric name changes the set of values to include all instances on the nominated hosts, at the current time.
For example filesys.free :otherhost is the most recent set of values for the amount of free space on every mounted file system on the host otherhost, and may be represented as follows:
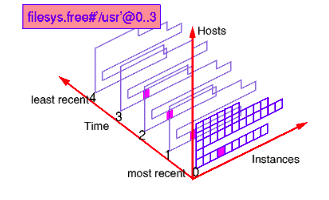
A suffix of the form @N..M after a metric name changes the set of values to be that formed by all instances on the default host for pmie, at the sample times N, N+1, … M back from the current time.
And finally more than one type of suffix may be used to control enumeration in each of the three axis directions.
For example filesys.free #’/usr’ @0..3 refers to the default host, restricts the instances and enumerates the time. This may be represented as follows:
12.5. Forms of pmie predicate
12.5.1. Existential quantification
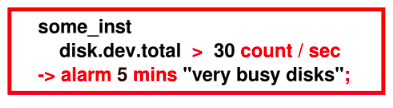
The predicate some_inst expr is true if there is some instance of a metric that makes expr true.
Existential quantification over hosts and consecutive samples is also supported by some_host expr and some_sample expr.
For example, the English statement:
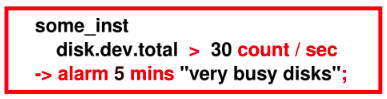
if some disk is doing a lot of I/O
then launch a visible alarm
may be translated into the following pmie rule:
12.5.2. Universal quantification
The predicate all_inst expr is true if expr is true for every instance of a metric.
Universal quantification over hosts and consecutive samples is also supported by all_host expr and all_sample expr.
Quantification predicates may be nested.
For example, the English statement:
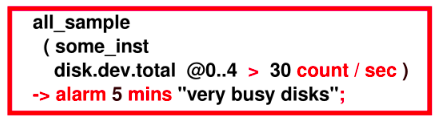
if for every one of the last 5 samples,
some disk (but not necessarily the same disk) is doing a lot of I/O
then launch a visible alarm
may be translated into the following pmie rule:
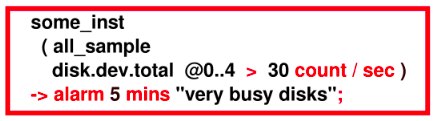
Note that reversing the nesting of the universal and existential predicates produces a rule which has slightly different English semantics, namely:
if the same disk has been doing a lot of I/O
for every one of the last 5 samples,
then launch a visible alarm
12.5.3. Percentile quantification
The predicate N%_inst expr is true if expr is true for N percent of the instances of a metric.
Percentile quantification over hosts and consecutive samples is also supported by N%_host expr and N%_sample expr.
For example, the English phrase:
if at least 30% of the disks are doing a lot of I/O
then launch a visible alarm
may be translated into the following pmie expression:
12.5.4. Other predicates
Instance quantification |
match_inst, nomatch_inst |
Value aggregation |
avg_inst, sum_inst, avg_host, sum_host, avg_sample, sum_sample |
Value extrema |
min_inst, max_inst, min_host, max_host, min_sample, max_sample |
Value set cardinality |
count_inst, count_host, count_sample |
Trends |
rising, falling, rate |
12.6. pmie expressions
pmie expressions are very similar to the C programming language; especially with regard to arithmetic, relational and Boolean operators, and the use of parenthesis for grouping.
The pmie language allows macro definition and textual substitution for common expressions and metric names.
// Macro for later use ...
bc = "buffer_cache";

// Using the above macro
// If the buffer cache is in use (more than 50 read requests)
// with hit ratio less than 90%, then popup an alarm
$bc.getblks > 50 && $bc.getfound / $bc.getblks < 0.9
    -> alarm "poor buffer cache hit rate";
All calculations are done in double precision, where default units are bytes, seconds and counts. Note that this can sometimes cause surprises:
mem.freemem > 10;
will always be true, unlike:
mem.freemem > 10 Mbyte;
Metrics with “counter” semantics have their units, semantics and values converted to rates.
For example, the metric network.interface.total.bytes measures the number of bytes passed across all of the configured network interfaces. The metric is a counter and the units are bytes. If pmie finds the value of network.interface.total.bytes to be 10000 and 15000 on consecutive fetches 5 seconds apart, then the pmie expression:
kernel.interface.total.bytes;
would have the value 1000 and the units of bytes/second.
12.7. Actions and parameter substitution of predicate context
The available pmie actions are:
alarm |
popup alarm notifier |
shell |
launch any program |
syslog |
write an entry in the system log |
print message to standard output |
Within the arguments that follow the action keyword, parameter substitution may be used to incorporate some context from the predicate in the arguments to the actions.
For example, when using some_host or some_inst in a predicate, it is most helpful to know “which hosts” or “which instances” made the condition true.
The following substitutions are available:
%h appearing in an action is replaced by the qualifying hosts
%i appearing in an action is replaced by the qualifying instances
%v appearing in an action is replaced by value of the left-most top-level expression in the expression tree that represents the parsed condition
12.8. Performance audit using archives
In this exercise, we shall use pmie to investigate performance from a PCP archive.
Use pmdumplog to report the details of when the archive was created and from which host the archive was created:
$ . /etc/pcp.env
$ tar xzf $PCP_DEMOS_DIR/tutorials/pmie.tar.gz
$ pmdumplog -L pmie/babylon.perdisk
Log Label (Log Format Version 2)
Performance metrics from host babylon
commencing Wed Jan 25 08:17:48.460 1995
ending     Wed Jan 25 14:12:48.457 1995
Archive timezone: PST8PDT
PID for pmlogger: 18496
Yes, PCP archives from that long ago still work today!
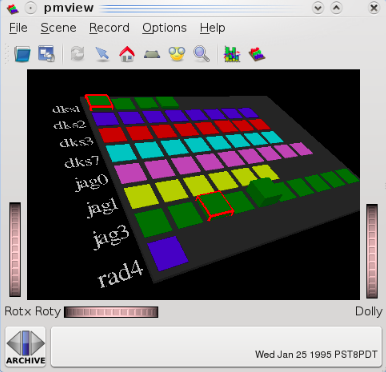
From running the command:
$ dkvis -a pmie/babylon.perdisk &
we can visually determine which disks and which controllers are active.
This is easy, which is good. However, consider the situation where we have a large number of separate archives, possibly collected from different machines and with different disk configurations. We’d like to be able to quickly process these archives, and filter out the extraneous information, to focus on those times at which the disks were busy, how busy they were, etc.
Using the pmie configuration file in pmie/disk.pmie as a starting point, run this against the archive:
$ pmie -t 5min -a pmie/babylon.perdisk < pmie/disk.pmie
Copy the configuration file and extend it by adding new rules to report different messages for each of the following:
some disk is doing more than 30 reads per second (make use of the disk.dev.read metric)
some disk is doing more than 30 writes per second (make use of the disk.dev.write metric)
some disk has a high I/O rate (consider a high I/O rate to be when the transfers are greater than 40 per second), and where reads contribute greater than ninety-five percent of the total transfers
some disk has a high I/O rate (as defined above) and the system’s 1 minute load average is greater than 5 (make use of the “1 minute” instance for the kernel.all.load metric).
Use the pmie/babylon.perdisk archive extracted earlier to cross check your rules as you add each one.
Hints:
Make sure you sample the archive every 5 minutes (-t 5min on the command line).
You’ll need to use existential quantification (the some_inst keyword) in all of the rules.
When producing the final rule, start with the load average metric using the command:
$ pminfo -f kernel.all.loadNotice there are three values corresponding to the 1, 5 and 15 minute load average.
For pmie the metric kernel.all.load is a set of three values, one for each instance at each point of time. To choose one instance append the # qualifier to the name of the metric and the name of a particular instance, e.g. kernel.all.load #’1 minute’.
The pmie(1) man page describes the pmie language in detail.
You may find it helpful to use dkvis to visually predict when the rules should be triggered. Using the PCP Archive Time Control dialog, you can position the dkvis display at the time where pmie is reporting interesting activity.
12.9. Influence of the update interval
As a final exercise, investigate the effects of using different update intervals on the pmie command line (the -t option) with the initial configuration file and archive from the previous exercise.
Try each of the following:
$ pmie -t 5min -a pmie/babylon.perdisk < pmie/disk.pmie
$ pmie -t 6min -a pmie/babylon.perdisk < pmie/disk.pmie
$ pmie -t 10min -a pmie/babylon.perdisk < pmie/disk.pmie
Why does the number of reported incidents decline as the rule evaluation interval increases?
Repeat the exercise but use pmchart:
$ pmchart -t 5min -a pmie/babylon.perdisk &
Use the New Chart… command of the File menu to plot the disk.dev.total metric for the disk jag3d5:
Enter the name disk.dev.total into the Metric Selection dialog.
There should be 54 instances of the metric listed. Find the instance jag3d5, select it, and press OK.
Use the PCP Archive Time Control dialog to change the Interval.
By using smaller values of the update interval, can you deduce the sampling rate of the data in the PCP archive?
Hint:
From a PCP archive you can get a dump of the raw data and timestamps when the data for a particular metric was collected using the command:
$ pmdumplog pmie/babylon.perdisk disk.dev.total | more